|

 Turtle is a well-suited program for studying - with the help of Monte-Carlo methods - the effects
degrader material has on the phase space of a fixed energy proton beam extracted from a cyclotron.
A Turtle input file (FOR001.DAT) for this degrader design problem is shown below.
Fig. 1 (21 kB) presents the HPLOT output of the 6 computed histograms. Histogram 1 shows the (x/x')
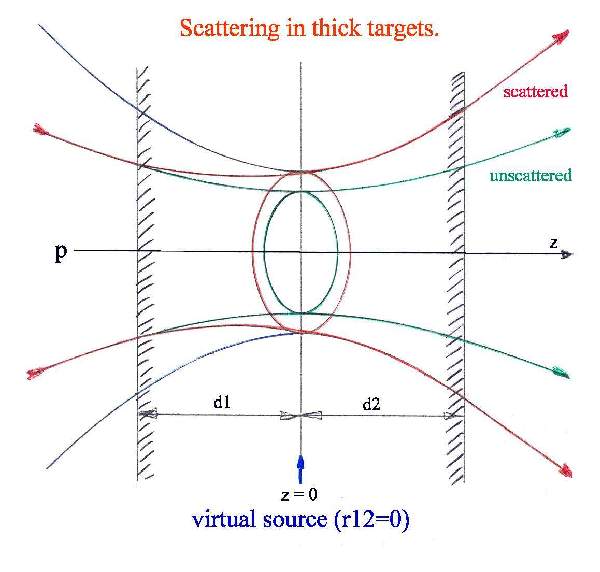
contour plot of the unscattered initial beam at the location of the waist (Corr = r12 = 0, inside the degrader)
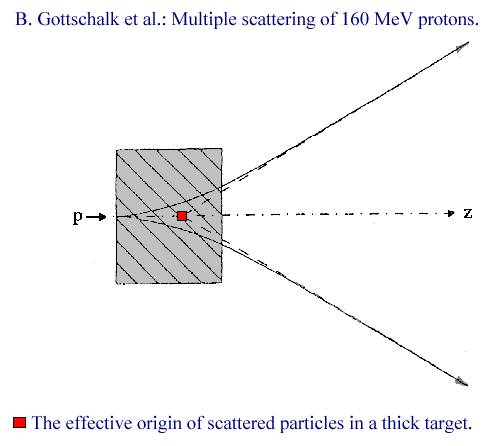
Histogram 2 shows the same for the scattered beam at the back-projected virtual waist position
(see Fig. 2 (34 kB)) or at the effective origin
(see Fig. 3 (22 kB)). The computed correlation coefficient
Corr (r12) is -0.01 or nearly zero. The (x/x') projected emittance
has increased by a factor of 150. Histograms 3 and 4
show the (x/y) spots at the virtual waist position and at the exit of the degrader material.
Histograms 5 and 6 are showing the momentum and the kinetic energy distribution of the protons
leaving the degrader. The FWHM of the dp/p-distribution is about 6.8 %. Because of the large angular straggling and
considerable momentum spread, a conventional beam line after the degrader can only transport about
1.5 to 2 % of the 70 MeV protons leaving the degrader. (For less degraded protons the transmission
will be higher.) For a typical proton beam line design (see
Proscan area layout) {Quadrupole aperture radius = 45 mm, dp/p (2
Turtle is a well-suited program for studying - with the help of Monte-Carlo methods - the effects
degrader material has on the phase space of a fixed energy proton beam extracted from a cyclotron.
A Turtle input file (FOR001.DAT) for this degrader design problem is shown below.
Fig. 1 (21 kB) presents the HPLOT output of the 6 computed histograms. Histogram 1 shows the (x/x')
contour plot of the unscattered initial beam at the location of the waist (Corr = r12 = 0, inside the degrader)
Histogram 2 shows the same for the scattered beam at the back-projected virtual waist position
(see Fig. 2 (34 kB)) or at the effective origin
(see Fig. 3 (22 kB)). The computed correlation coefficient
Corr (r12) is -0.01 or nearly zero. The (x/x') projected emittance
has increased by a factor of 150. Histograms 3 and 4
show the (x/y) spots at the virtual waist position and at the exit of the degrader material.
Histograms 5 and 6 are showing the momentum and the kinetic energy distribution of the protons
leaving the degrader. The FWHM of the dp/p-distribution is about 6.8 %. Because of the large angular straggling and
considerable momentum spread, a conventional beam line after the degrader can only transport about
1.5 to 2 % of the 70 MeV protons leaving the degrader. (For less degraded protons the transmission
will be higher.) For a typical proton beam line design (see
Proscan area layout) {Quadrupole aperture radius = 45 mm, dp/p (2 ) = 1.2 %, see also article from PSI Large Research Facilities Scientific and Technical
Report 2002, Volume VI, Optical Design of the Proton Beam Lines
for the Proscan Project (119 kB) [1]} the computed energy dependence of the transmission is shown in
Fig. 4 (10 kB). The relatively high
beam losses {for the loss-distribution along a typical proton beam line design see
Fig. 5 (8 kB)} induced by the usage of a fixed energy cyclotron together with a degrader are a
disadvantage compared to the usage of a variable energy synchrotron. On the other side modern
magnet and power supply design for a beam line together with a fast moving wedge degrader will
make it possible to perform an energy step equivalent to 4 mm range-change in water within
50-150 milliseconds (required for the Dynamic Spot Scanning).
If the same procedure is
used for different degrader thicknesses d=d1+d2, then you will get the energy dependence
shown in Fig. 6 (11 kB). From this graph it
is obvious, that for down-graded energies lower than 200 MeV d1 is growing faster than d2.
(The origin of the d1/d2-axis - parallel to the beam axis - is the position of the back-projected virtual waist of the
beam emerging from the degrader {see Fig. 2}.) The advantage of having the virtual source at z = 0 for all degrader thicknesses
is obvious: The distance of the source to the next quadrupole lenses downstream will then be energy-independent.
The values for the
multiple scattering parameters for a 0.2 mm thick graphite slice (density = 1.8 g/cm*3, Z=6)
are generated with the auxiliary program MUSCAT.
Fig. 7 (30 kB) shows the Muscat input und output windows for this case together with the
Turtle graphic input editor's (TGIE32.EXE) frame for the multiple scattering line of FOR001.DAT.
) = 1.2 %, see also article from PSI Large Research Facilities Scientific and Technical
Report 2002, Volume VI, Optical Design of the Proton Beam Lines
for the Proscan Project (119 kB) [1]} the computed energy dependence of the transmission is shown in
Fig. 4 (10 kB). The relatively high
beam losses {for the loss-distribution along a typical proton beam line design see
Fig. 5 (8 kB)} induced by the usage of a fixed energy cyclotron together with a degrader are a
disadvantage compared to the usage of a variable energy synchrotron. On the other side modern
magnet and power supply design for a beam line together with a fast moving wedge degrader will
make it possible to perform an energy step equivalent to 4 mm range-change in water within
50-150 milliseconds (required for the Dynamic Spot Scanning).
If the same procedure is
used for different degrader thicknesses d=d1+d2, then you will get the energy dependence
shown in Fig. 6 (11 kB). From this graph it
is obvious, that for down-graded energies lower than 200 MeV d1 is growing faster than d2.
(The origin of the d1/d2-axis - parallel to the beam axis - is the position of the back-projected virtual waist of the
beam emerging from the degrader {see Fig. 2}.) The advantage of having the virtual source at z = 0 for all degrader thicknesses
is obvious: The distance of the source to the next quadrupole lenses downstream will then be energy-independent.
The values for the
multiple scattering parameters for a 0.2 mm thick graphite slice (density = 1.8 g/cm*3, Z=6)
are generated with the auxiliary program MUSCAT.
Fig. 7 (30 kB) shows the Muscat input und output windows for this case together with the
Turtle graphic input editor's (TGIE32.EXE) frame for the multiple scattering line of FOR001.DAT.
[1] Note: At the end of this article, a planned study of the optical behaviour of the presented beam line layout
with the computer code COSY INFINITY has been mentioned. Meanwhile these
Cosy Infinity Higher Order Optical Computations have been done and the results are presented here.
Turtle input file for computing the effect of a 17.84 cm long graphite degrader design for a 250 MeV
proton beam.
/Degrader Design, 250->71 MeV/

100000

15. 11.0 /MeVc/ .001 ;
15. 12.0 /MeV/ .001 ;
15. 6.0 /PM/ .1 ;
15. 1.0 /MM/ .1 ;
16. 190. 0. 100. /FILE/ ; (Metafile for graphics = FOR100.DAT)

1.0 1.0 2.0 1.0 2.0 0.0 1.0 729.0 /BEAM/ ; (ex = ey = 2 * Pi mmmrad, Ekin = 250 MeV)
16. 3.0 1836.7 /MASS/ ; (Protons)
16. 165.0 /MULT/ ; (enable multiple scattering)
16. 160. /INVS/ ; (take inverse slits-->degrader or target)
16. 198. 100.0 ;
13. 10. ;

30. 250. 3.55 200. 4.05 100. 6.60 10.0 41.5 1.0 240.0 0.0 /dEdx/;

51. 1.0 -2.5 2.5 .25 ; (Histogram 1, x-axis)
52. 2.0 -5.0 5.0 .50 ; (Histogram 1, x'-axis)

3. -0.1194 ; ( -d1 )

9. 892. ; (loop over 892 degrader segments)
 6. 1.0 50.0 3.0 50.0 /SLIT/ ;
 1. 0.879 9.30 295.5 .630 144.2 0.0315 0.1261 0.0 /C/ ;
 3. 0.0002 ; ( 892 * 0.0002 = 0.1784 = d1 + d2 )
9. 0. ;  (end of loop)

3. -0.059 ; ( -d2 , back-projection to virtual source)
51. 1.0 -5.0 5.0 .5 ;    (Histogram 2, x-axis)
52. 2.0 -100. 100. 10. ; (Histogram 2, x'-axis)
51. 1.0 -5.0 5.0 .5 ;    (Histogram 3, x-axis)
52. 3.0 -5.0 5.0 .5 ;    (Histogram 3, y-axis)
3. 0.059 ; ( d2 )
51. 1.0 -10.0 10.0 1. ;  (Histogram 4, x-axis)
52. 3.0 -10.0 10.0 1. ;  (Histogram 4, y-axis)

50. 11.0 345.0 395. 2. ; (Histogram 5, momentum-axis)
50. 12.0 62.0 80. 1. ;   (Histogram 6, energy-axis)

16. 11. 371.85 /p0/ ; (new central momentum, e.g. for following bends)

SENTINEL
SENTINEL
 Back to:About Graphic Turtle
Back to:Proscan Area Layout
to: ![]() Urs Rohrer Index Page
Urs Rohrer Index Page
![]()
![]() Last updated by
Urs Rohrer on 25-Feb-2006
Last updated by
Urs Rohrer on 25-Feb-2006